
Dashboard
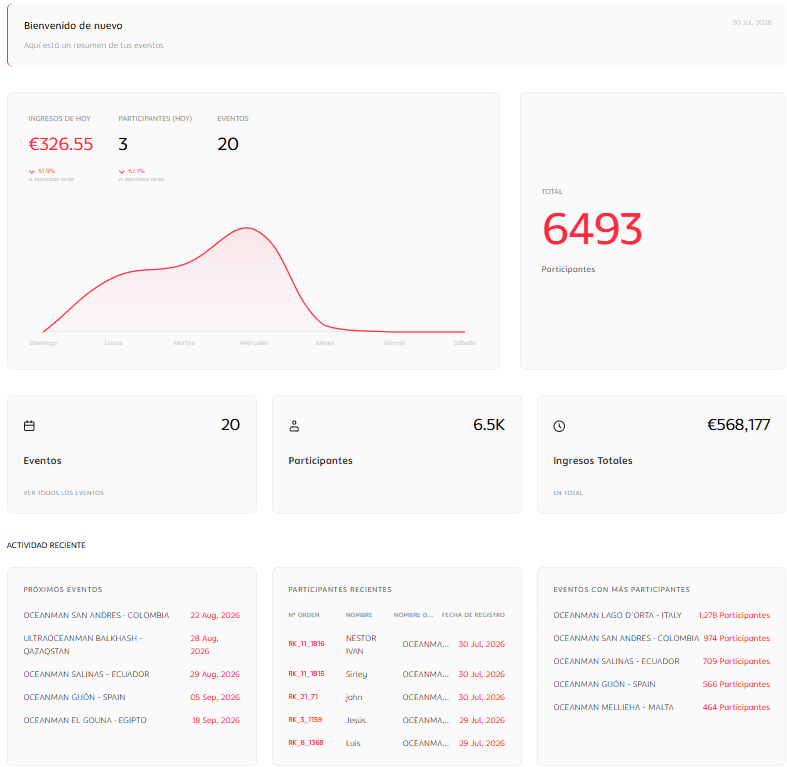
When you enter the platform (Dashboard in the main menu), you see an overall summary of your entire organization:- Today’s revenue, Participants (today), and Events, each with the percentage change compared to the previous day.
- A chart of participants for the last week (Sunday to Saturday).
- Total participants accumulated.
- Events, Participants, and Total Revenue cards.
- Recent activity, in three columns: Upcoming events (with date), Recent participants (order number, name, event, registration date), and Events with the most participants.
Available reports
Participant list
All registrants with their complete data.
Discount usage
Codes used and amount discounted.
Financial report
Revenue, commissions, and net settlement.
Event statistics
Full event statistics panel (see detail below).
Event statistics
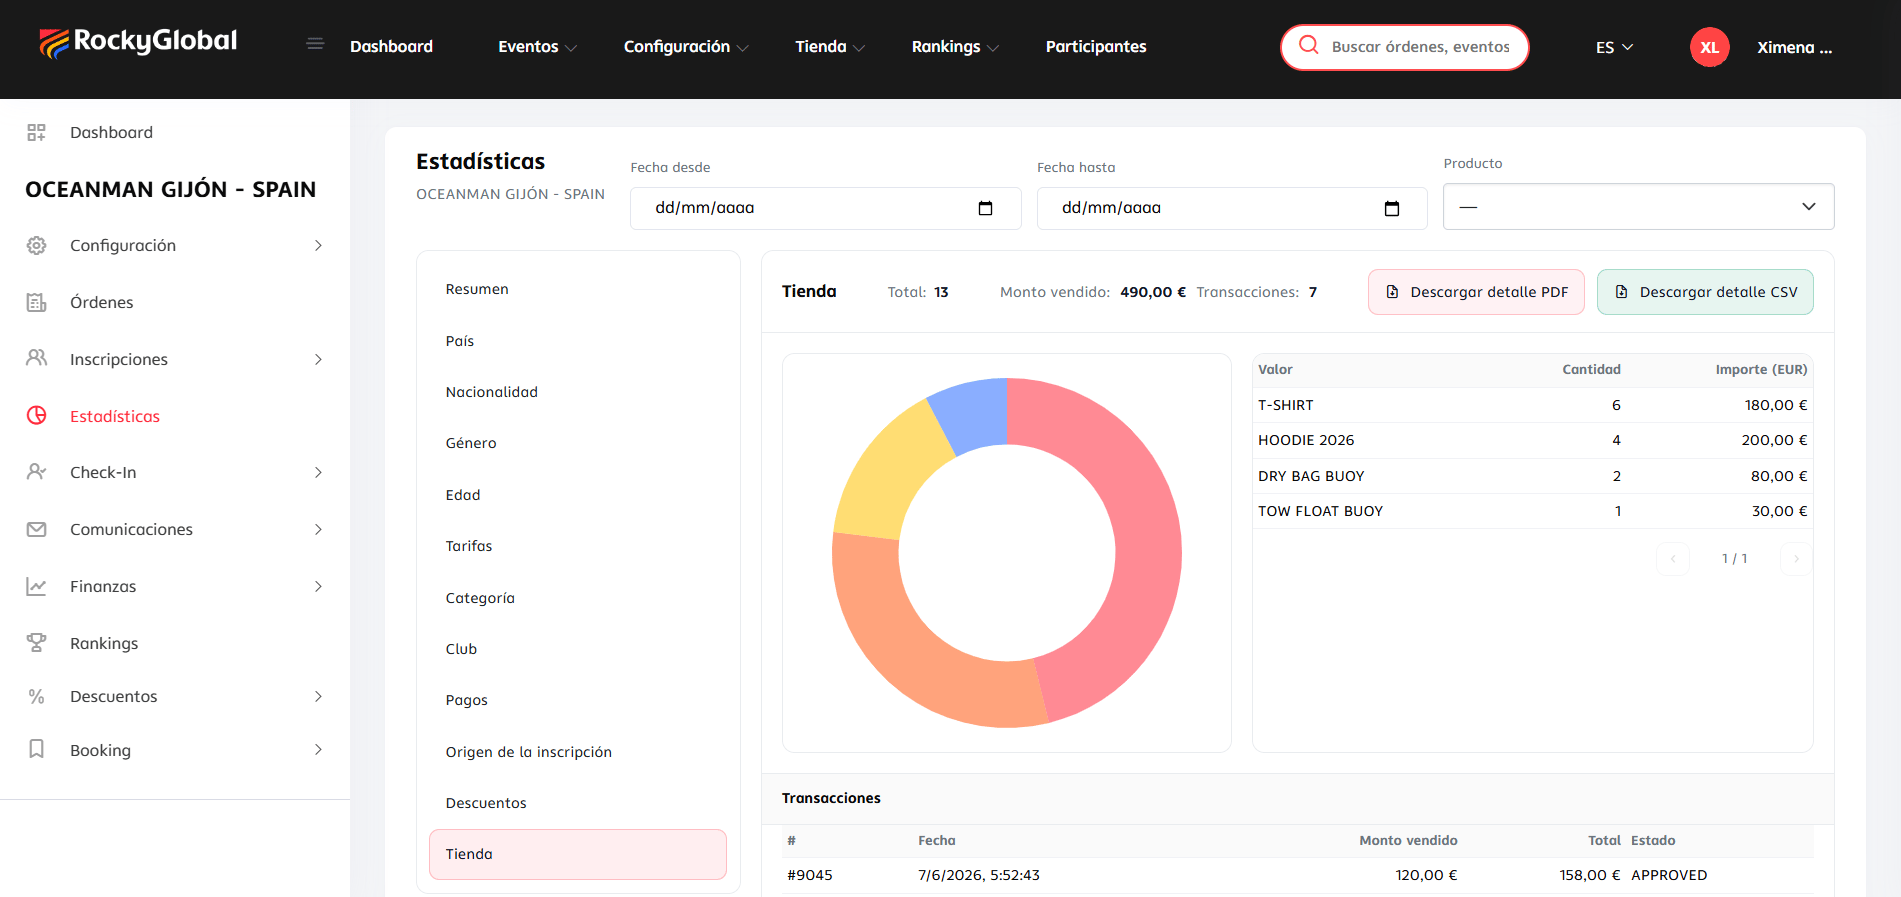
Within the event, the statistics panel offers quite a bit more than store sales:- Summary (dashboard): total registrants, unique countries, amount sold in store/hotel/additional services, and mini-charts of the most frequent countries, fees, registration source, and payment methods.
- Demographics: distribution of registrants by country, nationality, gender, and age.
- By fee and by category: how many registrants are in each one.
- By club: distribution of registrants by club.
- By registration source: online, imported, or manual.
- By payment method.
- Store and hotel/booking: sales by product or variant, with the detail of each transaction.
- Additional services: usage of “amount”-type add-ons from the registration form (for example, cancellation insurance).
- Discounts: coupon usage, approximate savings, and the most-used discount, filterable by type (fee, store, hotel, services).
How to export a report
1
Go to 'Reports'
Select the report you need within the event.
2
Choose a format
Participant, discount, and finance reports are exported in Excel (.xlsx). The Statistics panel is the exception: each of its metrics (summary, country, gender, age, fees, category, club, payments, source, discounts, store, hotel, additional services) can be downloaded as PDF or CSV, with transaction details included.
3
Download
For the participant list, if the file is large, it’s generated in the background and you’ll receive an email with the download link.